

Summary
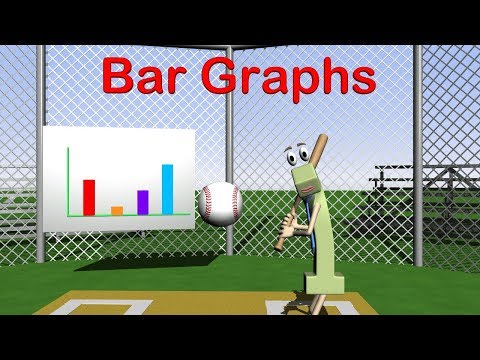
An animated Mage Math lesson on reading and building graphs — showing numbers as bars, pictures, or plots, made for grade 3. Bright 3-D animation walks kids through it with clear, worked examples they can pause and try.
Viewer safety
All ages
Our rating is a quick teacher-to-teacher guide — preview before showing.
Teaching resources
Discussion questions
Talk about it
Bar Graphs 3rd Grade clicks once you see it worked out. Watch an example, then use these questions to make sure it stuck.
- What does each bar or picture on the graph stand for?
- Which category has the most? The fewest?
- What question could this graph help you answer?
Quick work-a-long
Vocabulary: graph, category, data, compare.
Try it: Ask five classmates a yes/no question. Draw a bar graph of the answers and write one thing it shows.