

Summary
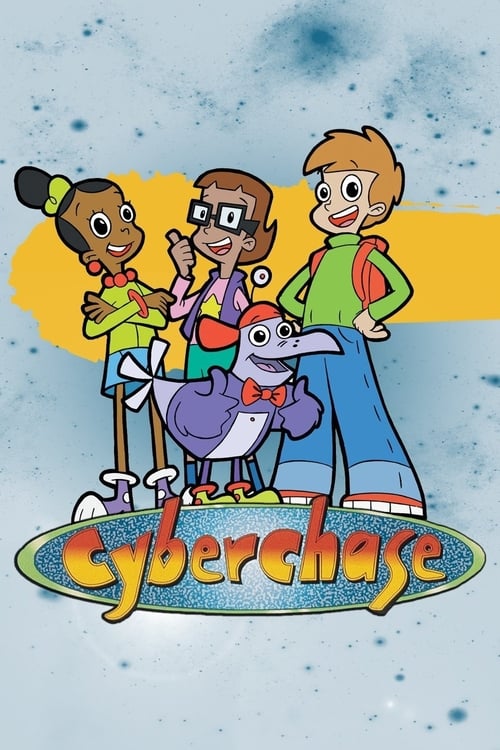
A Cyberchase segment where the CyberSquad analyzes bar-graph data and realizes the bars can mislead when the graphs use different scales. A sharp lesson in reading a graph's axis carefully.
Viewer safety
All ages
Common Sense Media — not yet ratedIMDb Parents Guide — not yet rated
Our rating is a quick teacher-to-teacher guide — preview before showing.
Teaching resources
Discussion questions
Discussion
- How did two graphs of the same data look different?
- Why does the scale on the side of a graph matter?
- How could a graph be drawn to trick you?
Quick work-a-long
Vocabulary: scale, axis, interval.
Try it: Look at any bar graph and write what each line on the side stands for.